Newsgraph: prometheusx.dyndns.org
You need Firefox or Chrome to properly see the page. Other HTML5 browsers should be able to support it (IE9, Safari), but I have been unable to test them.
I realized recently that it’s very easy to lose track of big news items. Perhaps you’ve gone on vacation or have just been really busy, but the stories that are on the collective conscience for the day can sometimes pass you by.
Inspiration
As mentioned, I wanted to find a way to graph news over time. I find that it is easy to fall out of the loop with news, particularly when away for vacation or whatever reason. I wanted a way to quickly see the important news that you have missed.
A long time ago I had seen an interesting visualization of news but was unable to find it again until I had started this project: newsmap.jp. It provides a detailed view of the news that is happening right now. Despite using Flash, the interface is much more solid than the one I have put together. My design was certainly influenced by seeing this.
Algorithm
The page is populated via Google News stories. Google News provides RSS feeds, free for non-commercial purposes (so no, I don’t plan on making money from this). The various RSS feeds are regularly polled and update the stories as needed.
The popularity of a given article is determined by the associated number of articles for the given story. I don’t think this is the best metric because I think some stories are more likely to generate articles for the sake of SEO and ad-revenue. The SEO optimization of journalism is a pretty broad concern for new media, but it tends to influence the page more than I would like. I would like to use other means, perhaps number of commenters for different stories or pageviews. Obviously, these would not be perfect either. By using something like what your friends are reading would be interesting as well, but the social aspect would make the page completely different.
The page is essentially the Top 40 of news.
Technical Challenges
Determining the appropriate text size was difficult, because of the wide range of possible shapes. I needed fonts that were readable for the wide range of popularity (some articles are orders of magnitude more popular than others). Additionally, once the font was determined for popularity, it needed to be adjusted if words were going to creep into the surrounding boxes.
The javascript below outlines how I dealt with the font size and the wrapping issue. Basically, my javascript will loop through all the words and attempt to fit them on a line until that line is full, if adding a word exceeds the width of the rectangle, remove the last added word and insert the given words. If there is only one word and it exceeds the width of the rectangle, shrink the font by an appropriate amount so that it will fit and then insert the given words.
var fontSize = (10+numArticles/800); |
function textBreak(context, text, x, y, fontSize, lineHeight, maxWidth, maxHeight){ words = text.split(' '); var lowCount = 0; var lines = 0; for(var n = 1; n < words.length+1; n++){ context.font = "bold " + fontSize + "px " + font; var line = words.slice(lowCount,n).join(' '); var width = context.measureText(line).width; if(width+3 > maxWidth){ if(n > lowCount+1){ n--; } else{ var fontDiff = (width+3)/maxWidth; context.font = "bold " + fontSize/fontDiff + "px " + font; } context.fillText(words.slice(lowCount,n).join(' '), 3+x, y+ lineHeight*lines); lines++; lowCount = n; } } if(lowCount < words.length){ context.fillText(words.slice(lowCount,words.length).join(' '), 3+x, y+ lineHeight*lines); } } |
The other issue that was a bit difficult to figure out was how to link to the articles. You cannot use a href for different sections of the canvas. You could wrap the entire canvas with one, but then you obviously couldn’t get to individual articles. I ended up creating a mouseup function that would look up links in a dictionary for given X,Y coordinates. Since articles are all aligned on the X-axis for the days of the week when drawing articles, I could populate an object that would map the starting X-value for a given day of the week to the starting Y-values for the stories on that day. This provided an efficient solution that covers the entire area of the canvas and maps them to the necessary stories.
The method for adding values to this object is:
function addLink(xStart, yStart, link){ if(linkMap[xStart] == undefined){ linkMap[xStart] = {}; } linkMap[xStart][yStart] = link; } |
The javascript code can all be viewed simply by viewing the source of the page. I just chose to highlight some of the more challenging issues here.
Design Iterations
One of the things I wanted to do with this project was get a little background with the HTML5 canvas object. I originally had many canvases, but that ended up treating them more like div’s and was not the approach I wanted. Canvas objects are quite easy to draw basic shapes with, such as a bunch of interacting rectangles.
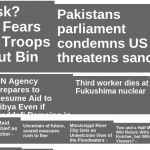
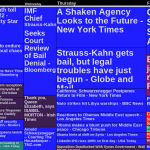
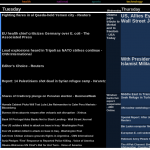
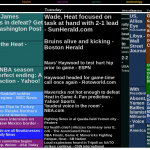
The attached screenshots demonstrate some of the design process. Originally, I had laid out the news stories as a series of canvas objects, that I decided size on by a fixed multiplcation depending on the number of articles for the story. The layout was monochromatic and would scroll down fairly far. The second image shows the majority of the layout for the Newsgraph, the day widths are determined by total amount of news for a given day and the total area for a story was indicative of the total number of stories. The last two screen shots show the present state of the application, you can click on different topics and see the most popular stories from the past week for that topic, with older stories fading to black. The final screenshot shows the “all” category of news that makes up the general page.
I hope somebody finds this useful, I did it primarily for my own satisfaction and as an interesting way to visualize news over time. Please send me any questions/comments/concerns.
Appendix
Apologies if the site is slow to load or shows issues. Unfortunately, my web-hosting is none too accepting of Ruby on Rails (webhostingbuzz.com). This left me with a few options: use a more static web coding or host it myself. Since I wrote this as a proof of concept more than anything else, I decided rather than re-writing the RoR application, I would just host it myself. However, the rails application does very little, it serves up a static webpage and then provides an XML feed of the news. It could have been relatively easily re-created in a different language.